Population- 4,313,707
Arithmetic/Crude Density (people per total land)- 77.1
Physiological Density (people per arable land)- 690,193.1
Agricultural Density (Farmers per arable land)- 5098.1
CBR- 9 births/ 1,000 population
CDR- 12.1 deaths/ 1,000 population
NRI- -3.1
Net Migration Rate (# per 1000 people)- -1.9 migrants/ 1,000 population
Population Growth Rate- -0.5%
IMR-
TFR- 1.39 children born/woman
Population Age <15% - 14.22%
Population Ages 65+ % - 18.81%
Dependency Rate- Total= 51.1%
Life Expectancy at Birth (total)- 75.9 years
Life Expectancy at Birth Females- 79.2 years
Life Expectancy at Birth Males- 72.7 years
HIV/AIDS Among People Ages 15-49 - N/A
Obesity Rate- 25.6%
Demographic Transition Model-
Arithmetic/Crude Density (people per total land)- 77.1
Physiological Density (people per arable land)- 690,193.1
Agricultural Density (Farmers per arable land)- 5098.1
CBR- 9 births/ 1,000 population
CDR- 12.1 deaths/ 1,000 population
NRI- -3.1
Net Migration Rate (# per 1000 people)- -1.9 migrants/ 1,000 population
Population Growth Rate- -0.5%
IMR-
- Total- 9.5 deaths/ 1,000 live births
- Male- 9.2 deaths/ 1,000 live births
- Female- 9.8 deaths/ 1,000 live births
TFR- 1.39 children born/woman
Population Age <15% - 14.22%
Population Ages 65+ % - 18.81%
Dependency Rate- Total= 51.1%
Life Expectancy at Birth (total)- 75.9 years
Life Expectancy at Birth Females- 79.2 years
Life Expectancy at Birth Males- 72.7 years
HIV/AIDS Among People Ages 15-49 - N/A
Obesity Rate- 25.6%
Demographic Transition Model-

I believe Croatia is in stage 5 of the demographic transition model. This is figured because the rate of natural increase is in the negatives. Another way to tell is also because it has a low birth rate that even drops below the low death rate.
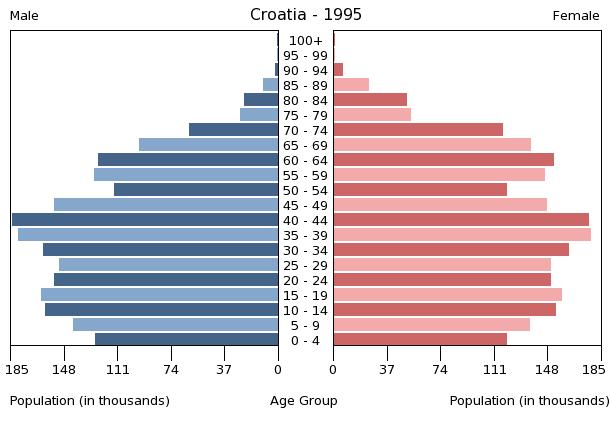
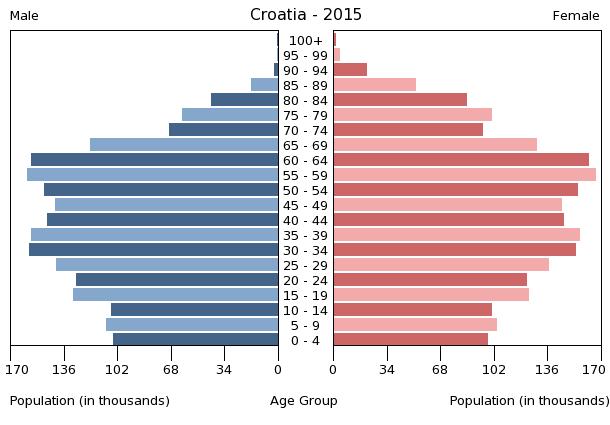
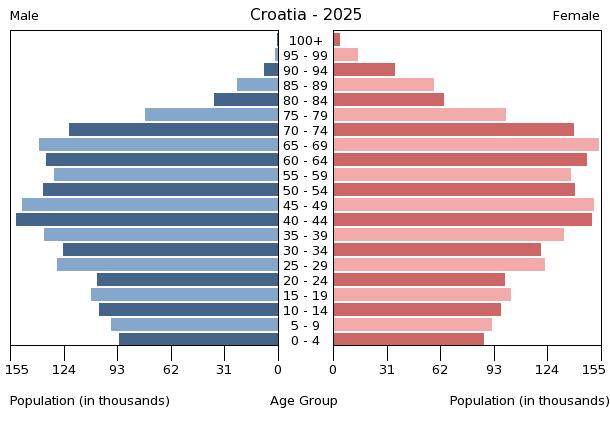
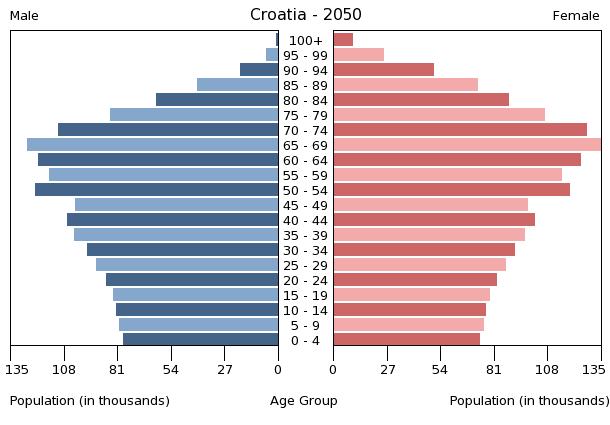
Population Pyramids-